
What are the statistical methods for analyzing data collected during market research?
Most market surveys, particularly quantitative surveys, collect a large amount of useful data, to be analyzed in statistical terms in order to obtain useful information and understandable reports for companies.
Statistical methods are used precisely for the purpose of analyzing and studying data collected during surveys, and are applied purely to quantitative data.
Not that qualitative data are neglected, we would miss it! But in order for us to analyze them with statistical methods for market research, we need to turn them into quantities.
Typical example: if we calculate a numerical scale, a qualitative value can become a number.
Guess what? Today we will delve precisely into statistical methods applied to data intercepted during a market research, so that you can better understand how amarket research agency working with Big Data online can proceed… Like us at Central Marketing Intelligence!
Let us begin, first of all, with the characteristics of the data to be analyzed by these particular methods.
The 5 characteristics of Big Data that we mine during market analysis

Our method as far as market research is concerned (we emphasize OURS because we are the only agency in Italy that operates in this way!) is tolisten to the web, that is, what people on the web are saying about a market, a company, competitors and more.
Listening to the net, in Social Listening jargon, involvesintercepting a large amount of online data with the use of powerful software, carefully set up so that it returns data consistent with our objective.
For example, if we want to do a very specific search and intercept mentions about a particular company, we are going to intercept those and only those… Not all online conversations related to the industry in which the company operates.
In any case, if we wanted to listen to conversations related to an entire sector, we could do so. And indeed we do, if it helps us give useful information to our customers!
Let’s get straight to the point: intercepting a large volume of information data means mining Big Data, which, to be defined as such, must exhibit 5 characteristics:
- Volume. Thanks to new technologies, such as social listening software, we have the fantastic opportunity to store huge volumes of data.
- Speed: Big Data flows at very high speed, and we need to handle it in a timely manner.
- Variety: these data arrive in all kinds of formats (from structured and numeric data in traditional databases to unstructured data such as text documents, e-mail, video, and audio).
- Variability. Data streams can be highly inconsistent with periodic spikes.
- Complexity. They come from multiple sources, and it is necessary to match, clean, and transform cross-sectional data.
The real value of Big Data comes not from its raw form, but from the information that results from its selection, processing, and analysis.
This means that in order to derive value and knowledge from this huge amount of data, important statistical methods must be applied!
Read also: Business Strategy: why you can no longer do without Marketing Intelligence
Types of Big Data in market research
In addition to having the 5 characteristics we told you about earlier, Big Data falls into two types:
- Censuses (total surveys), which analyze the entire statistical population involved in the study. Identifying a reference population means specifying eligibility conditions, i.e., the characteristics that statistical units must meet to be part of that population. An example might be identifying the satisfaction of all participants at an event.
- Samples (partial surveys), which confine the analysis to a part of the statistical population, identified through the sampling technique. They aim to generalize the results obtained on the sample to the whole population. An example? The survey of the satisfaction of a portion of customers who have used a service.
Census data can be Istat censuses, the study of all users who attended an event or tested a product, but also the study of Google searches for a given keyword.
Sample data are, for example, the results of a survey, a social listening study or Google Trends.
In the case of network listening, it does not always make sense to ask whether we are analyzing all users, because no social listening software tracks everything!
It is impossible because of the privacy restrictions of social, but also because of the nature of some forums and news outlets: we have to hook up a crawler to track the data, yet there will always be mini-forums that are impossible to track.

But this does not matter, because listening to the network and consumers’ opinions is not about making simple statistics. It is an understanding of people’s behavior and how the audience really feels about a product/service or brand.
Once a brand has this awareness, it can win the minds of millions of customers.
To learn more, read this article, “Statistical sample for market research: here’s when it’s valid and when it’s not. “
Let us now focus on the methods of statistical analysis in market research.
The methods of statistical analysis of quantitative data
Once we have obtained quantitative data through special software, we need to analyze it based on precise statistical methods. Here are which ones:
- Descriptive Statistics
- Inferential Statistics (Statistical Inference)
- Exploratory Statistics (Exploratory Analysis)
Descriptive statistics is a statistical method that analyzes the criteria for collecting, classifying, summarizing and representing data obtained from the study of a population or sample, i.e., a part of the population itself.
The results obtained through the application of this method can be called certain… Unless you make measurement errors due to chance (do you want to know what the average of these errors is? It is zero!). In contrast, inferential statistics can also include bias.
Statistical inference is the analysis whereby characteristics of a population are identified by observation of a sample, usually selected by a random experiment.
Exploratory statistics, on the other hand, is a set of techniques aimed at looking for correlations among data. The main techniques include:
- Cluster Analysis (Clustering or Cluster Analysis): the study of groups of similar variables, such as within social listening analyses, to identify who is talking about similar topics. Working with tools for statistical analysis, such as R software, specific functions can be used to group similar variables into groups.
- Principal component analysis, which aims to minimize the number of variables without losing significance and completeness.
Statistical analysis of data is also distinguished into monovariate, bivariate and multivariate based on the number of variables analyzed.
Monovariate, bivariate and multivariate statistical analysis methods: what are they?
Monovariate analysis studies the behavior of only one variable at a time, either absolutely or in a time series.
Several statistical parameters are used to analyze these variables, namely:
- frequency – number of times the detection occurs
- average – average value of the surveys
- median – central value of the surveys
- dispersion and variance, mean square deviation – to assess the range width
For example, the study of Google searches in a given month is an analysis of only one variable, as an average value over the past 12 months.
But here’s a real-world example: in the following table we show you the study of monthly Google searches for the terms used in Spain to mean pants.
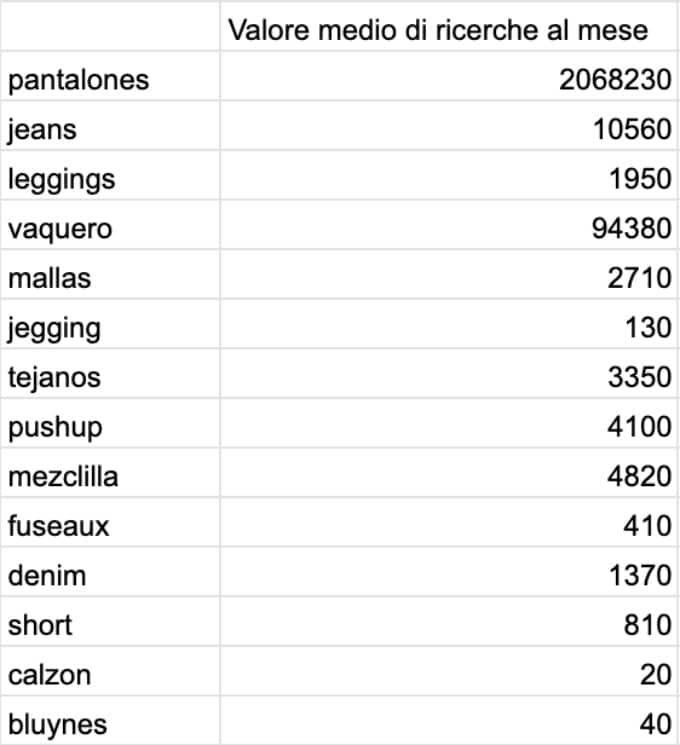
These data are represented with histograms, pie charts, bar charts, time trend diagrams, other diagrams such as radar or tree representations.
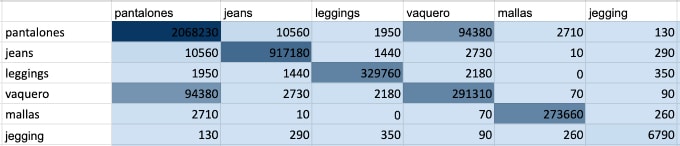
Bivariate and multivariate analysis , on the other hand, are used to assess whether two or more variables are related to each other, that is, to assess “correlation” and “co-presence.”
In the case of correlation, it tests whether the variation of one determines that of the other or whether the behavior of one can be explained by the other.
Still following our pants example, we can study how different words are matched in Google searches and understand which ones are related.
Bivariate and multivariate analysis also applies to social listening to observe mentions that mention multiple topics together:
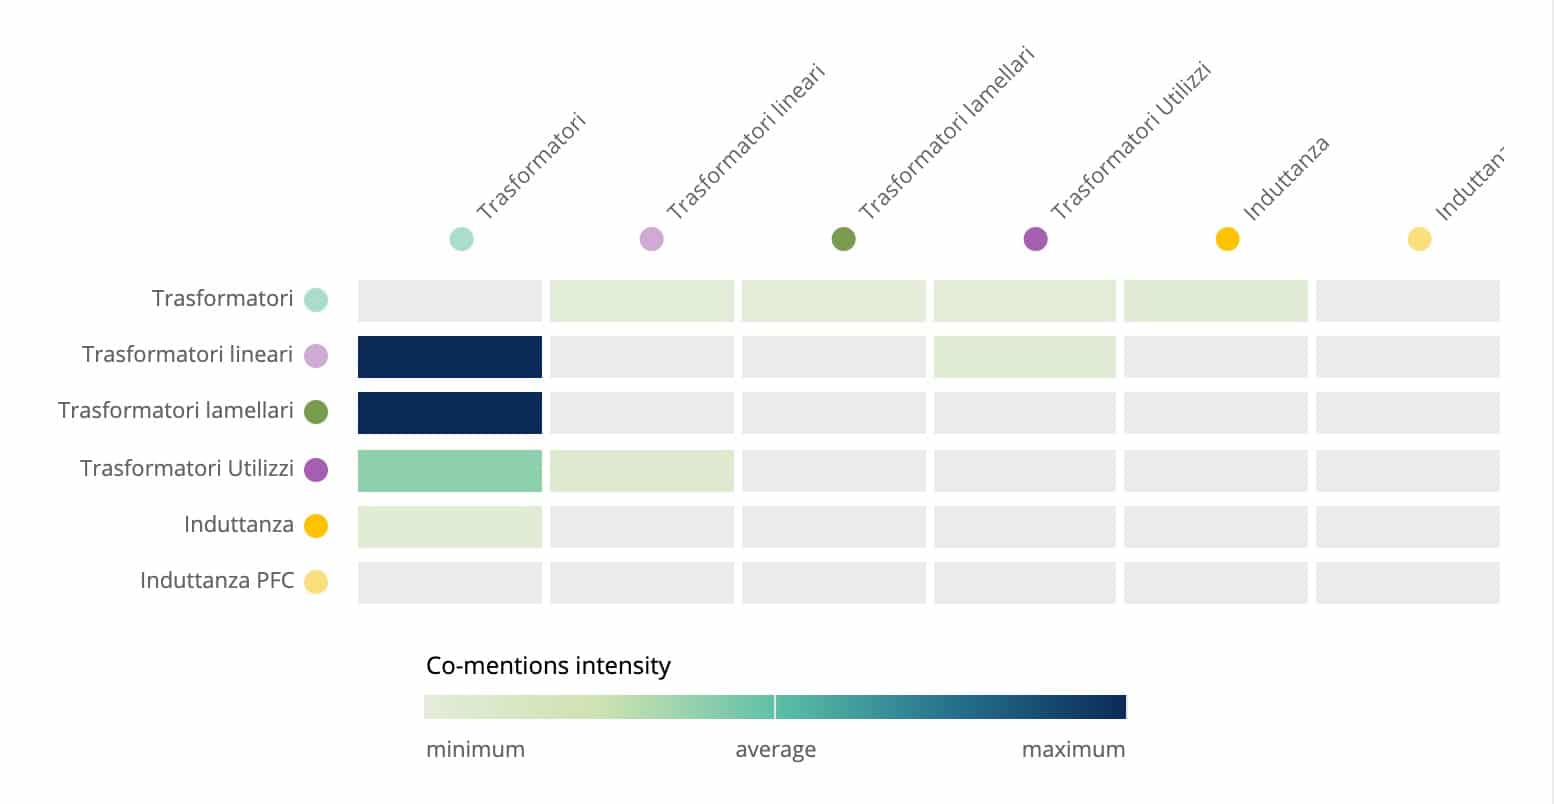
Or, again, we look at the correlation between two independent variables, volume and change over time, to create clusters and understand each variable in which falls.
These data are represented with tables, bubble or scatterplots, color scale graphs, and Cartesian graphs.
In conclusion
The skill of an analyst is also in understanding–based on each objective and for each type of data analyzed–what is the best way to study the data with the right parameters and, subsequently, how to represent them with an appropriate visualization… So that those who read the reports do not see a set of incomprehensible data and information but can use the results to benefit their company!
For example, with one or more market analyses you can improve sales and customer service (yes, these are two related topics!), marketing strategies, avoid reputational crises, and much more.
More simply, we can uncover information left online by people to find out all about the desires, expectations, and opinions of your company’s target customers to use for your benefit!
Now that you’ve got your mind off statistical methods, do you want to know how market research can help you grow in your market?
Contact us now : We are here to offer you full support in achieving your goals!